Judge profiles
Every judge, in numbers.
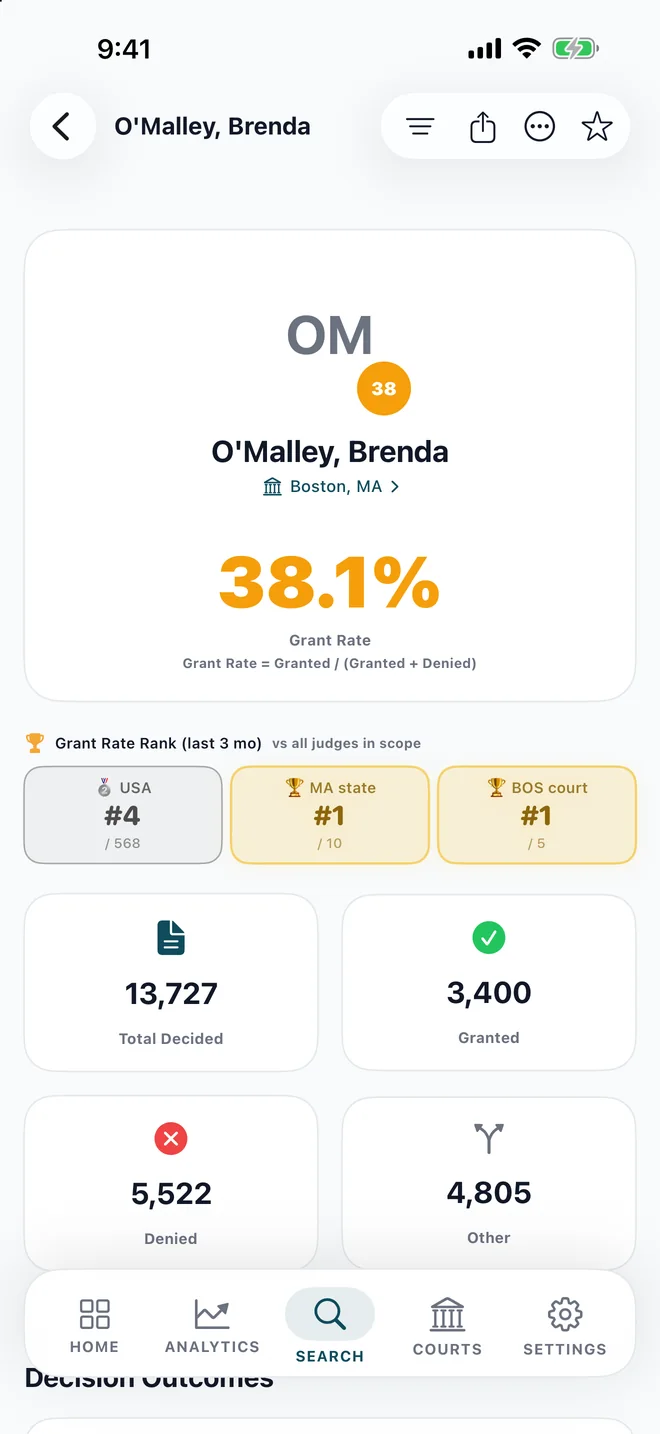
Grant rate, decisions, rankings and monthly trends for 1,497 judges across 77 immigration courts.
1,497judge profiles
6,538,746decided cases
See how your immigration judge and court have ruled — grant rates, outcomes by nationality, wait times and trends, built on 6.5 million decided cases from official EOIR records.
Example screens from the iOS app
Judge profiles
Grant rate, decisions, rankings and monthly trends for 1,497 judges across 77 immigration courts.
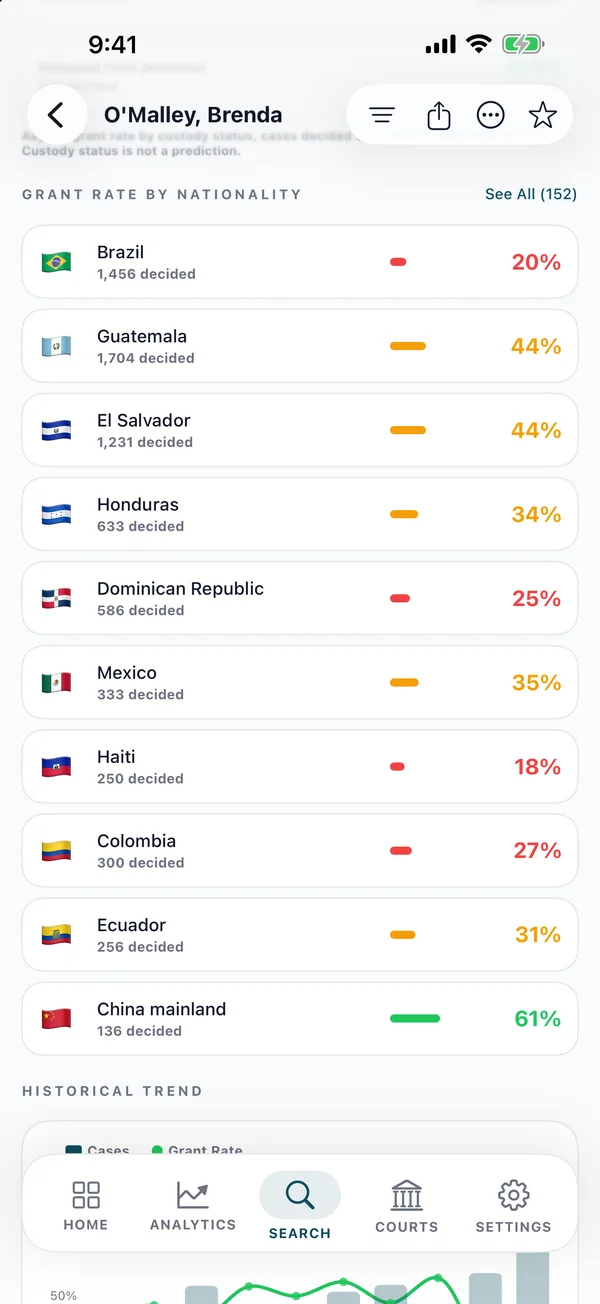
Nationality
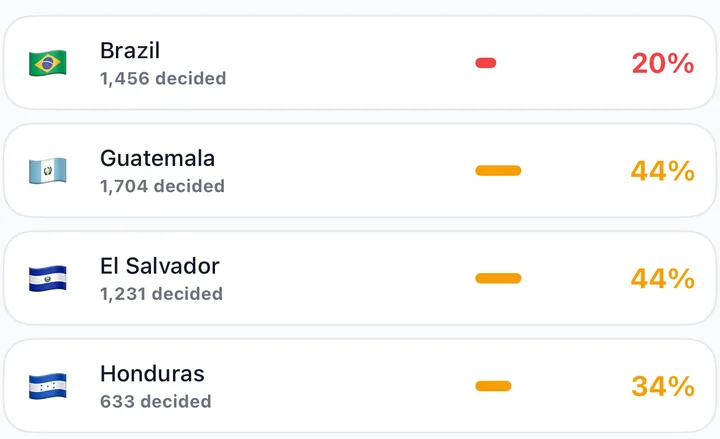
Grant rates differ sharply by nationality. See how your judge has ruled for people from your country.
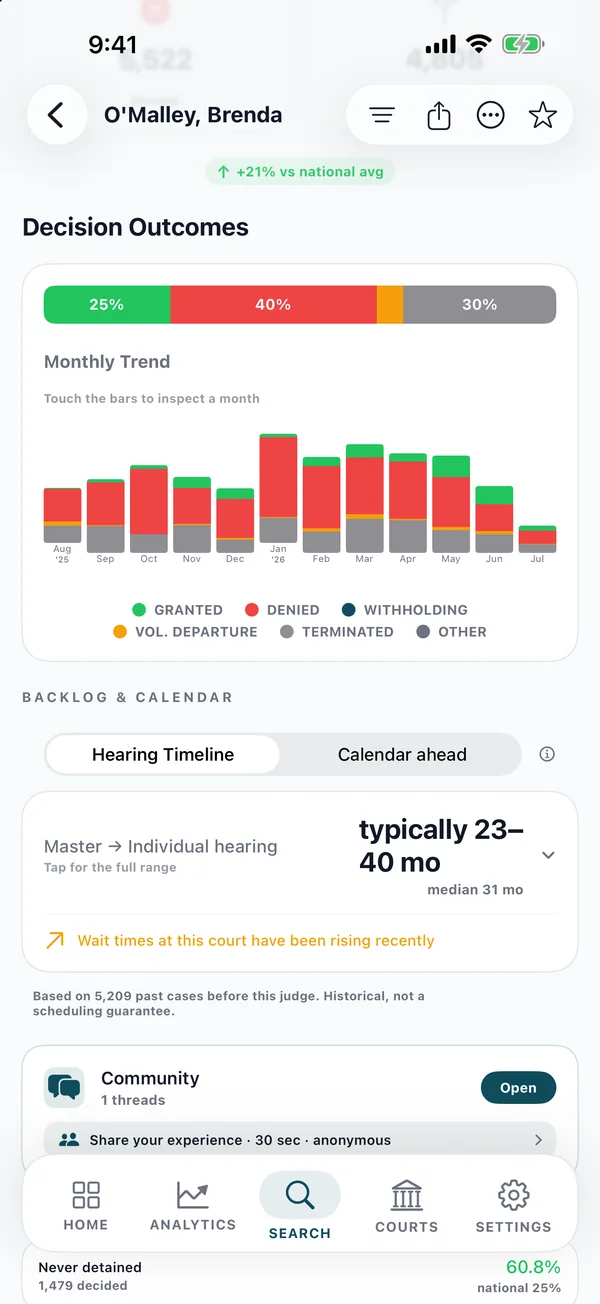
Trends
Nationwide, the grant rate went from 34.8% in 2021 to 3.0% in 2026.
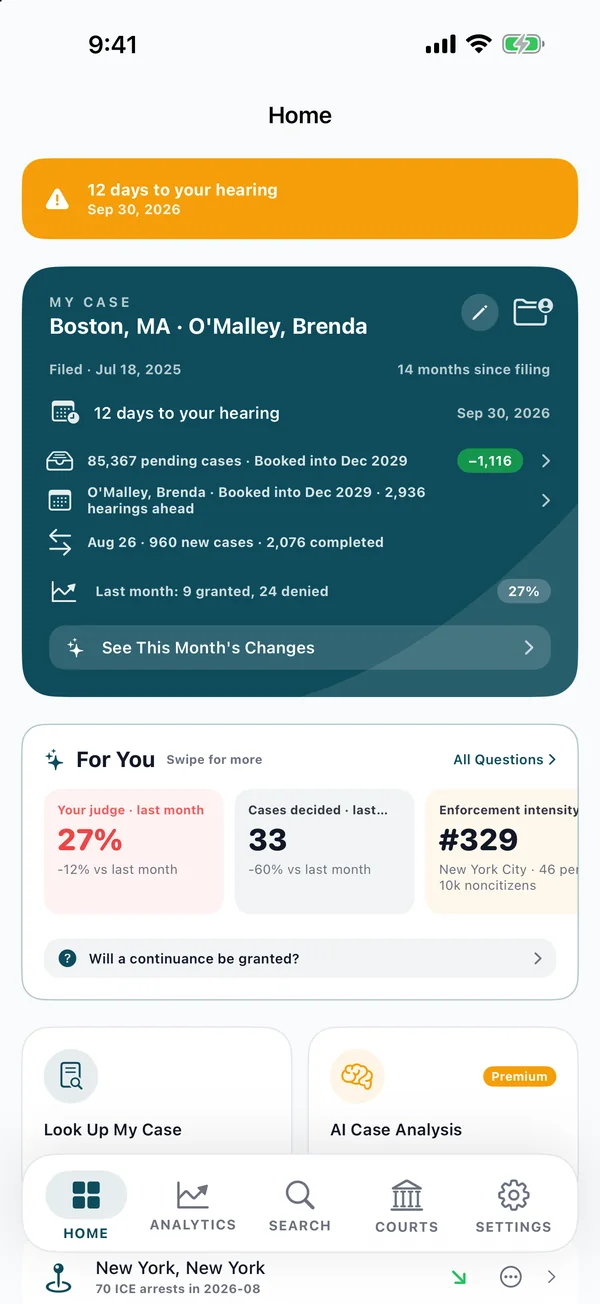
My Case
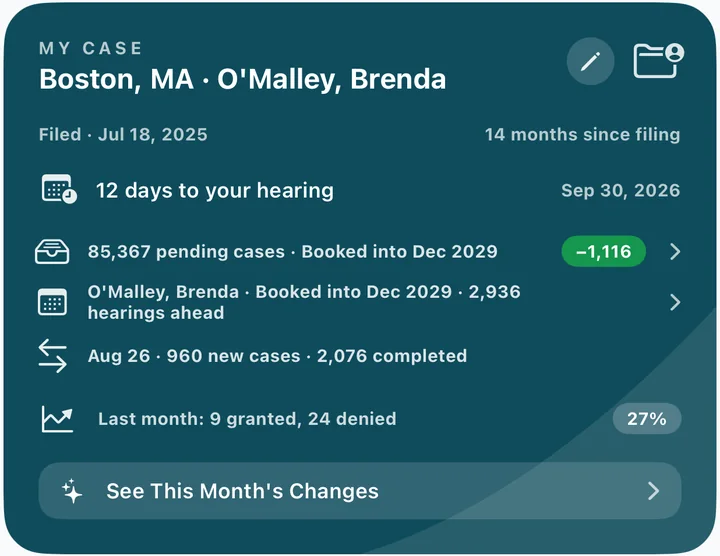
Save your judge and court. The app keeps what matters for your hearing in one place.
Each dot stands for about 500 of them.
16.6% nationwide — granted ÷ (granted + denied).
Keep scrolling: same court, very different judges.
Why your judge matters
Cases are assigned to judges — nobody chooses. Each dot is one judge at the selected court, placed by their historical asylum grant rate.
At New York City, NY, 77 judges range from 0.0% to 75.7%.
Each judge's all-time EOIR decided outcomes across every court they have served in: granted ÷ (granted + denied). Judges now based at this court with at least 100 decided cases. A historical pattern — not a prediction for any case.
Where you're from matters too
The same court can decide very differently for different nationalities. Choose one to compare its national rate with the courts that hear the most of those cases.
National grant rate, 2020–2026
8.6%
170,537 decided
Courts hearing the most cases
EOIR decided outcomes 2020–2026. Courts with at least 300 decided cases for this nationality.
Nationality detailsOne app. The whole picture.
Wait times
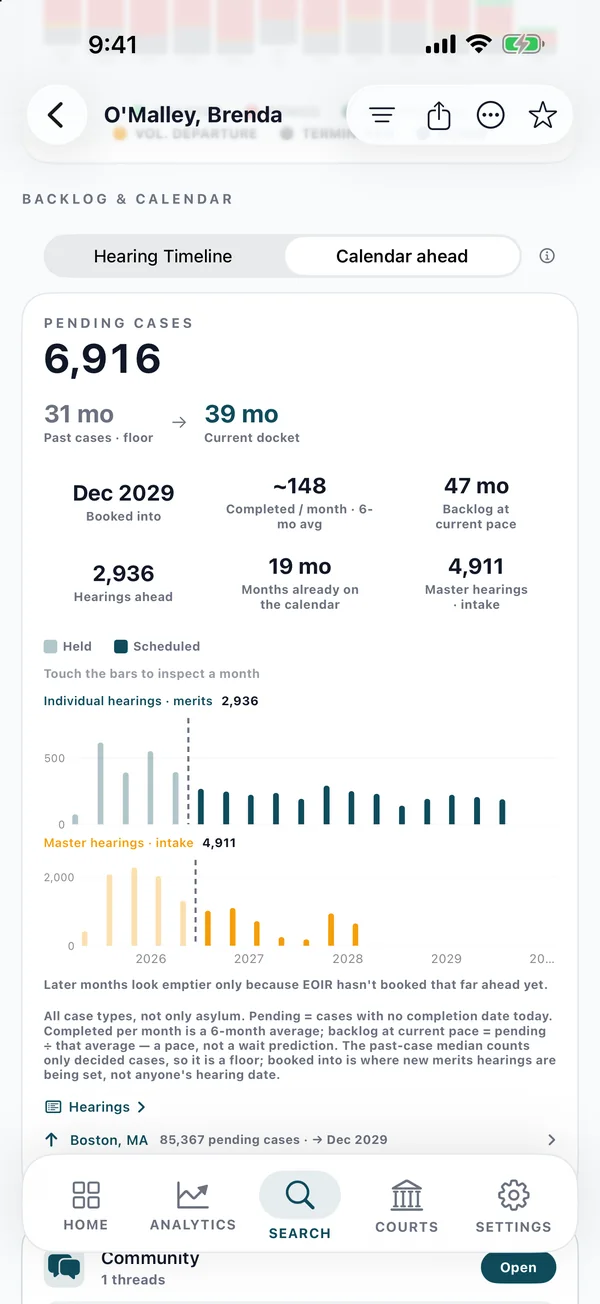
Historical hearing timelines, pending cases and how far ahead your court is booked.
Court transfers
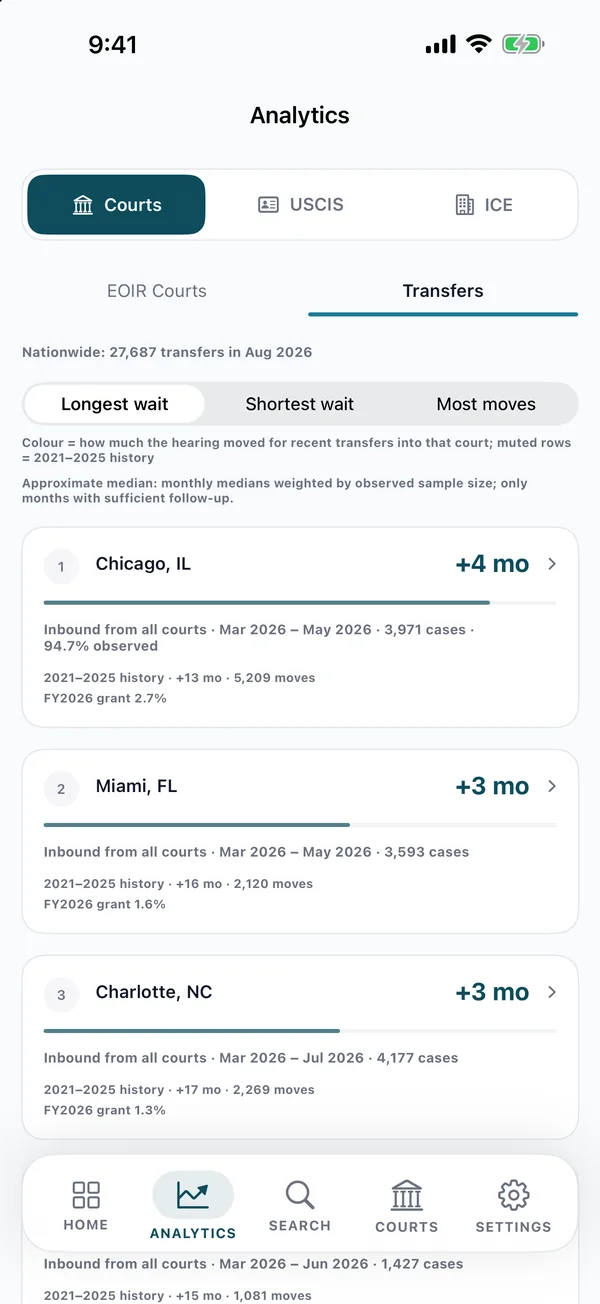
See how hearing dates changed for people who transferred into each court.
ICE detention
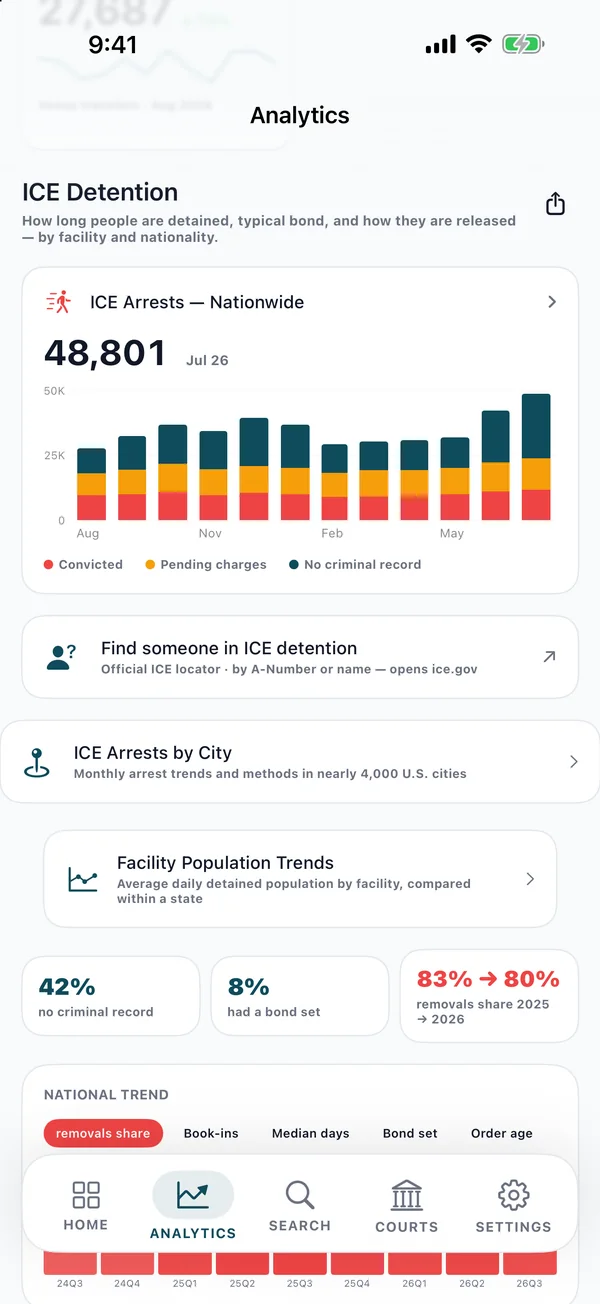
Detention facilities, bond and release patterns, and ICE arrests by city.
Community
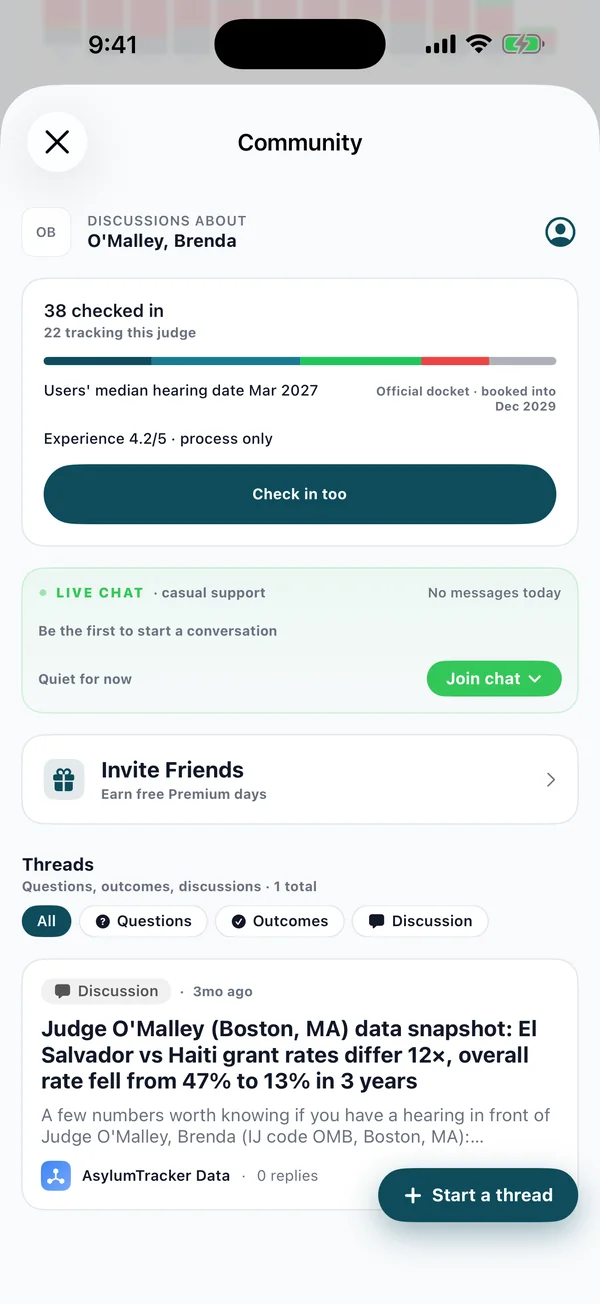
Anonymous check-ins and discussions from people with the same judge.
AI analysis
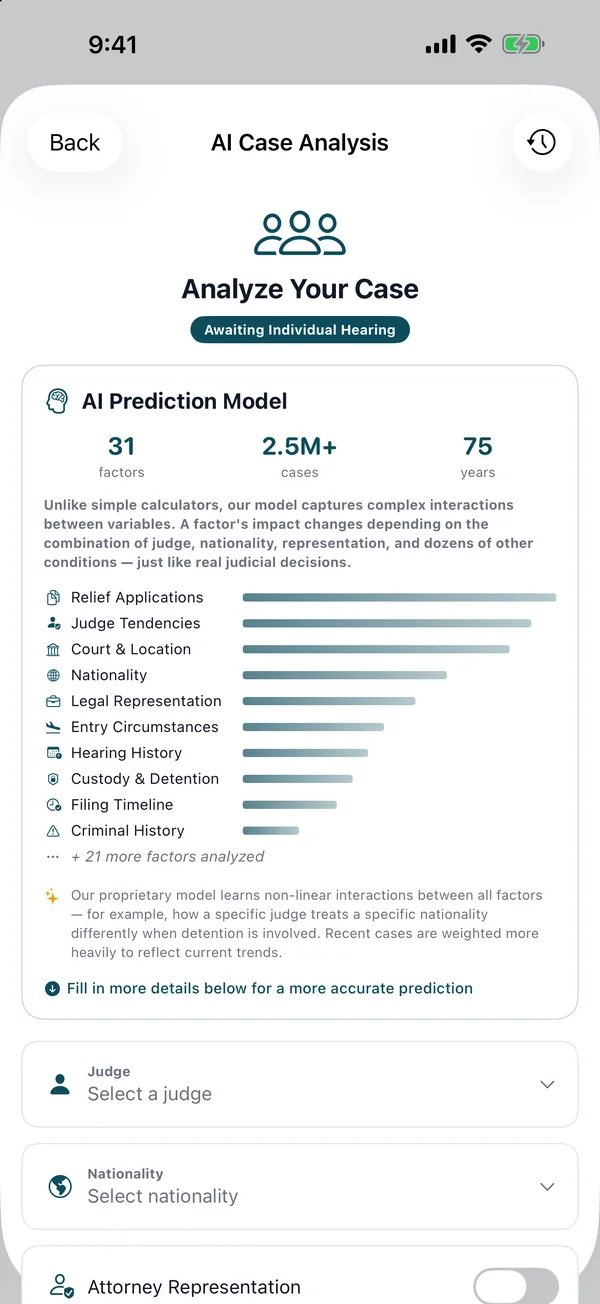
An estimated range from similar past cases, with the factors behind it. Not legal advice.
USCIS
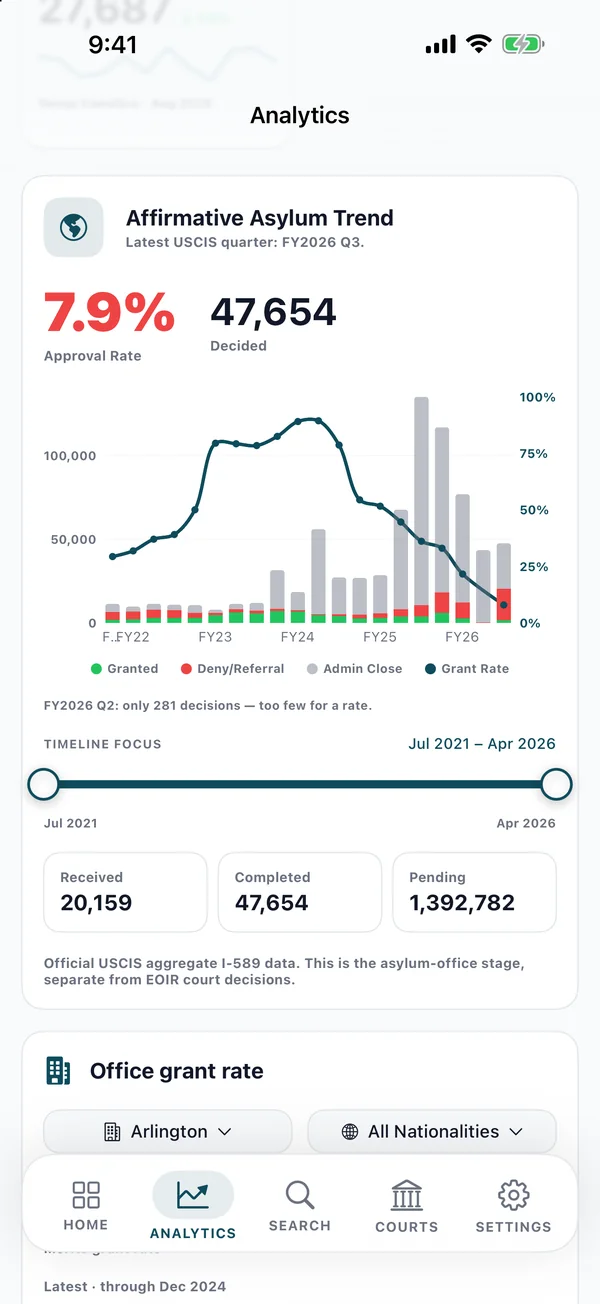
Grant rates and trends for USCIS asylum offices.
Built on the public record
Every rate comes from the Executive Office for Immigration Review's public case data, refreshed monthly. Current snapshot: Sep 1, 2026.
Grant rate = granted ÷ (granted + denied). The number of decided cases sits beside every rate.
Historical patterns are not predictions. AsylumTracker is independent — not a government service, and not legal advice.
For attorneys & representatives
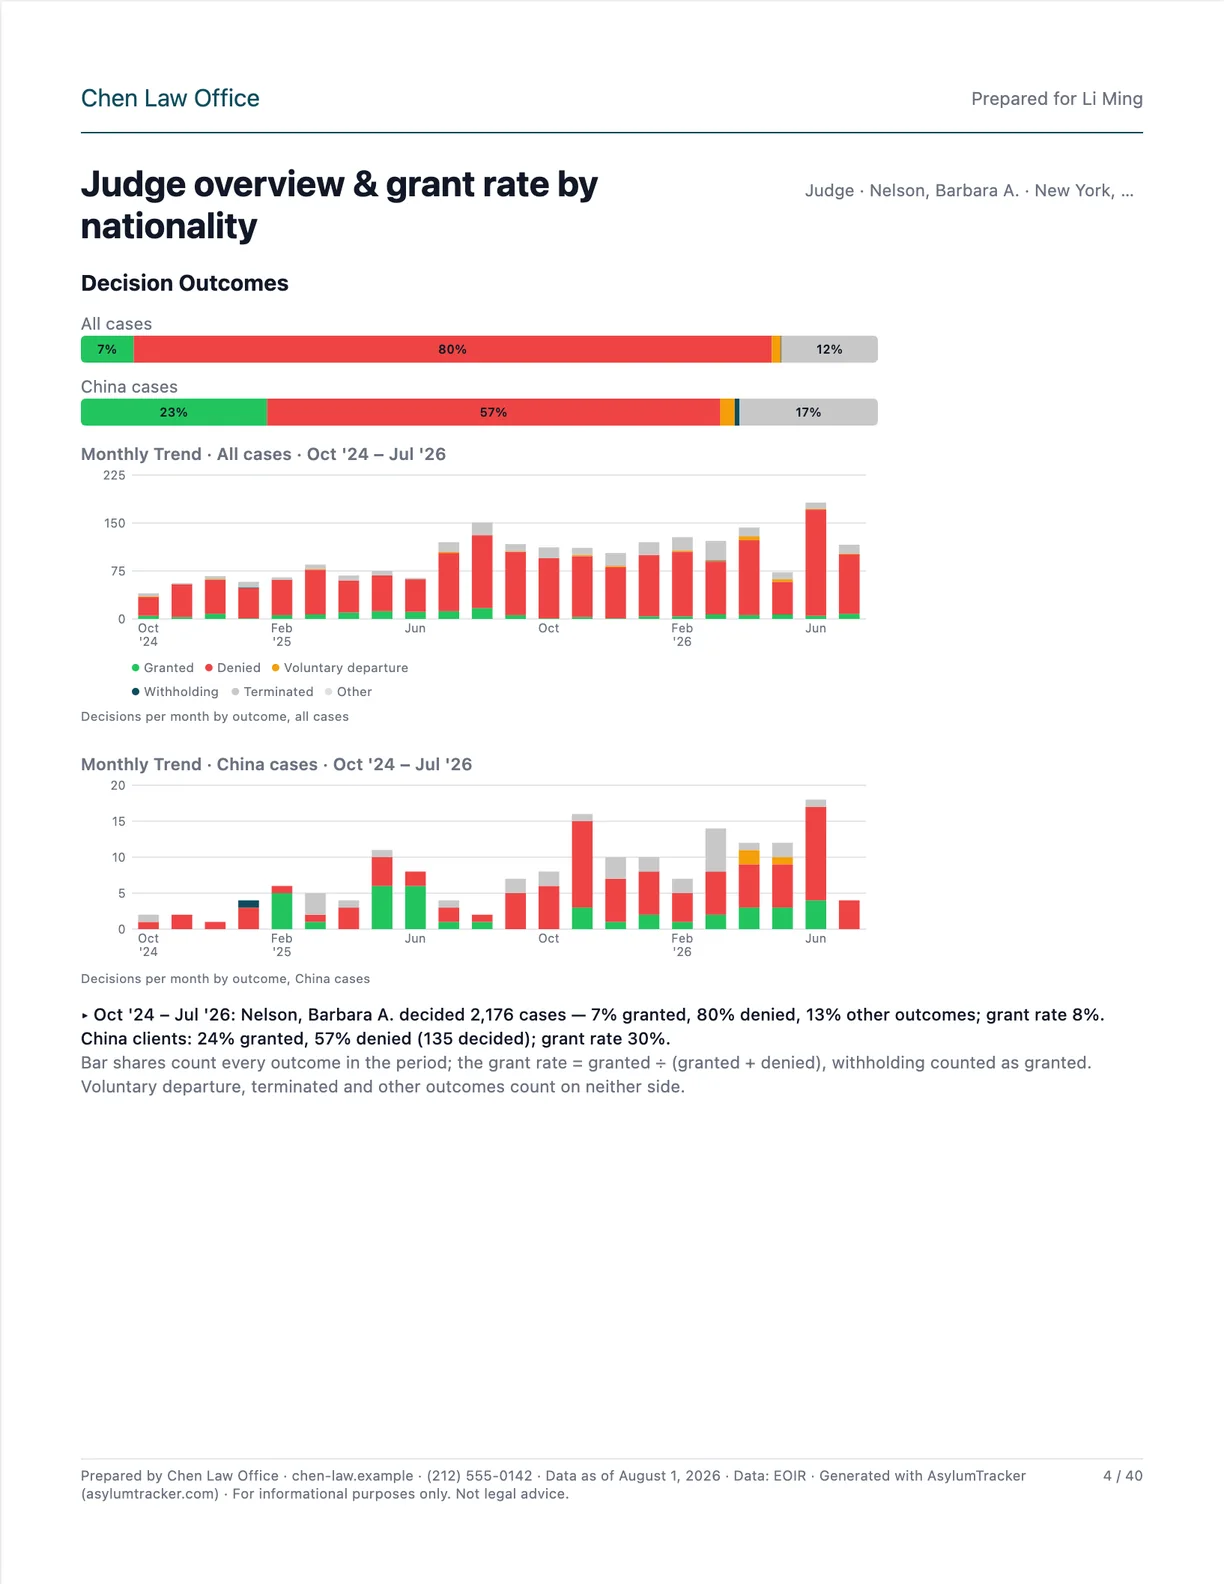
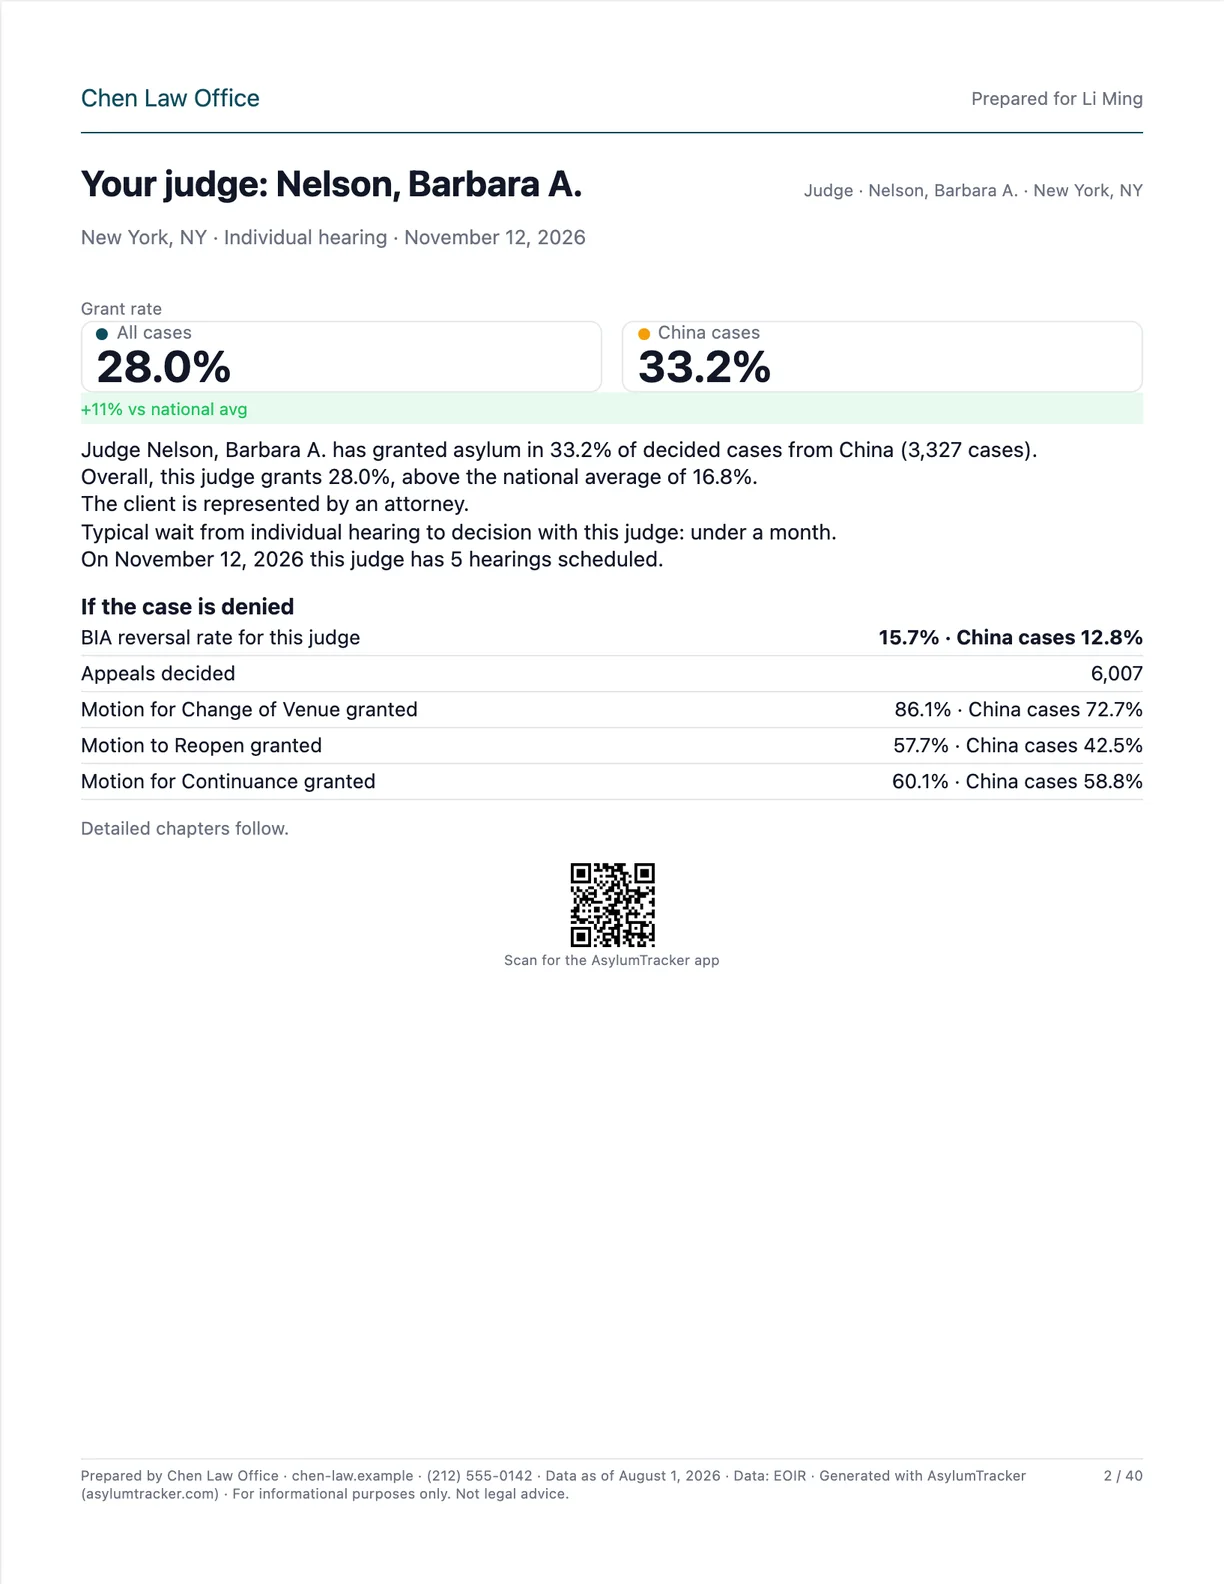
Your client's judge, on paper: grant rates for all cases and for the client's nationality, the yearly trend, wait times, motions, appeals, bond and hearing history. Preview free, export for one credit.
Yes. Search any judge or court on this page — no account or A-number needed. The app adds your own case dashboard, nationality and trend detail, wait times, transfers and more.
No. These are historical outcomes for groups of cases, not a prediction or legal advice for your individual case. Many factors — evidence, representation, case type — shape any single result.
From the public case data published by the Executive Office for Immigration Review (EOIR), part of the U.S. Department of Justice. We refresh it monthly and show the snapshot date on every page.
The app is free to download and offers in-app purchases. Features, subscription options and prices are shown in the app and may vary by platform.
The app is available in English, Spanish, French, Portuguese, Hindi, Chinese, Russian, Arabic and Turkish.

Download AsylumTracker for iPhone or Android.
Scan with your phone camera to download